UK Housing Market Chart Book
30 November 2018
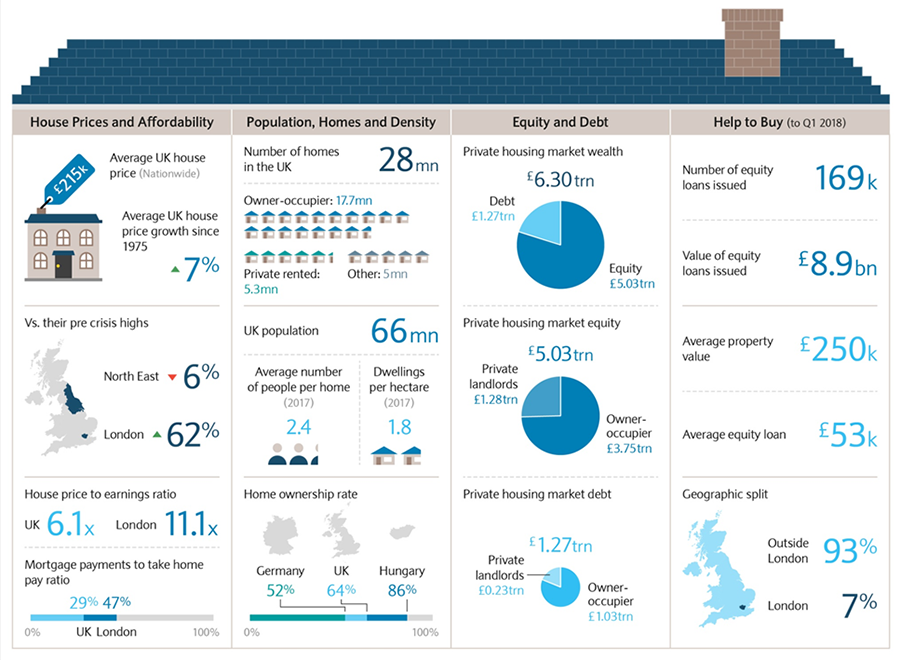
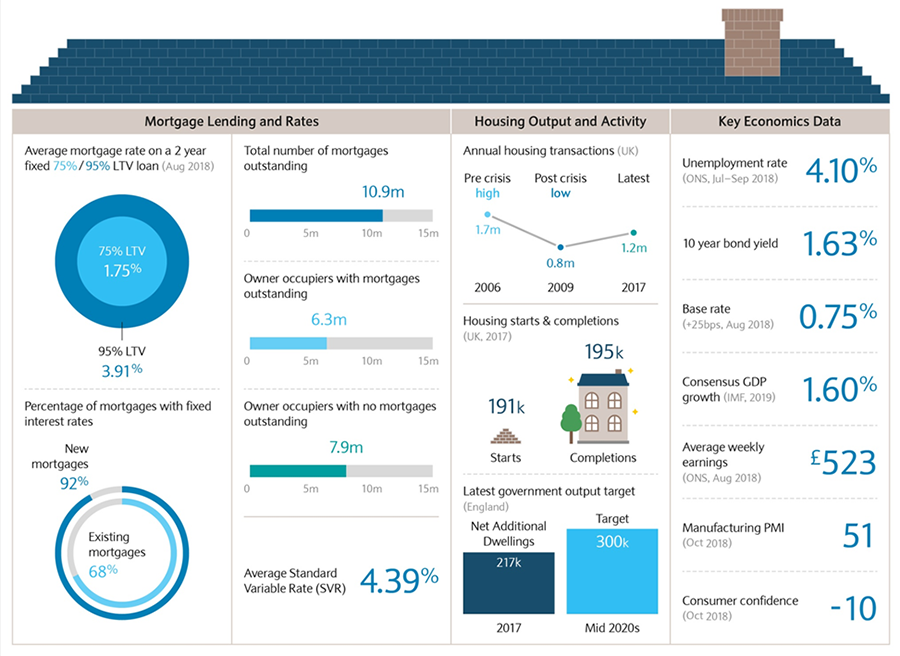
Created by Barclays featuring LonRes Data These infographic charts are taken from the recently published Barclays UK Housing Market Chart Book. They are a great resource, offering a detailed overview of the UK housing market, which we are sure will be of interest to LonRes subscribers. LonRes are regular contributors providing data on the average price per square foot of a property to buy and to rent across prime London’s postcodes for the November issue. Compiled by Barclays’ research team exclusively for the bank’s investor clients, this is a regular publication which provides a comprehensive snapshot of what’s happening in the UK’s housing market right now.
For further information, please contact: Marcus Dixon Or, find out more about our ResResearch service. Disclaimer: While we make every effort to ensure our information and data is as robust as possible we cannot guarantee its accuracy or completeness. Those looking to place reliance on LonRes content do so at their own risk. LonRes shall not be liable for any loss or damage, direct or indirect, arising from inaccuracy or incompleteness of the data or any decision made in reliance upon the data. None of the information or data included within this document is intended to constitute investment advice or a recommendation to make (or refrain from making) any kind of investment decision and may not be relied on as such.
Head of Research
LonRes
research@lonres.com
020 7924 6622
Sign up to the Lonres newsletter