Under offer volumes in PCL
28 November 2019
Annual change in under offer volumes – PCL rolling three months
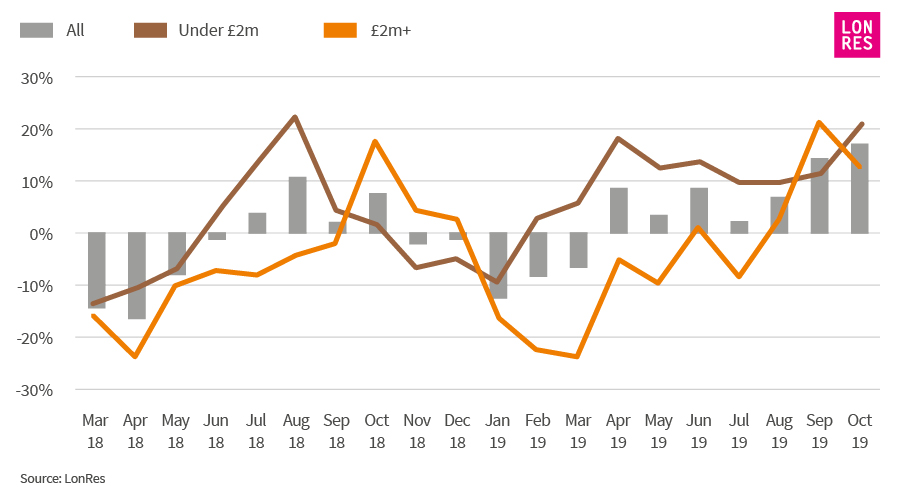
Source: LonRes - Rolling three months include properties going under offer in the previous three months – Oct 2019 data will include properties going under offer between 1st August and 31st October 2019.
What does the chart show? At LonRes, one of the ways in which we track market activity is by monitoring the number of properties going under offer. Under offer data is a good lead indicator. It gives us a sense of what’s likely to happen to sales numbers over the coming months. Comparing the three months to October 2019 with the same period a year ago shows the number of properties going under offer rose 17%. Properties going under offer for less than £2 million rose for the eighth consecutive month. While under offer homes priced at £2 million or more rose every month from August onwards, compared with the same period a year earlier. Why is this an indicator? Whereas transaction data compares the number of properties exchanging contracts in a specific period, under offer numbers are based on an offer being accepted in some cases several months before the actual sale takes place. This means that by comparing the number of properties going under offer we have an indication of market confidence at a specific point in time as well as an indicator of sales volumes over the coming months. What this means? We have started to see an increase in activity across London’s prime markets. LonRes figures showing the number of homes exchanging contracts in prime central London in the three months to October rose 24% annually. This follows an increase in the number of properties going under offer since April. Despite a general election looming in December, the increase in properties going under offer provides some welcome positivity for the prime market. Supporting our view that the rise in activity in the latter part of 2019 could well continue as buyer see value in London’s prime postcodes.
Sign up to the Lonres newsletter